
Does stable growth of revenues lead to higher returns?
One of the interesting aspects about factor investing is that it is about the question what a good company looks like - an attractive business that is. A characteristic that often comes to mind is stable revenue growth. Or stable Gross Profit growth, or any other line on the Profit & Loss or Cashflow Statement.
Surely, when a company has a stable growth history that signals something about the quality of the company. Right? Let's find out!
To do this, we can rank companies through time. But we will need a formula for that based on the the P&L line item that we are interested in.
You could think of stable growth as a high correlation between the line item (e.g. revenue) and time. So as time progresses, you will want to have revenue align with it. When the correlation is 1, then as the years (or quarters, or another time period) go by, revenue goes up.
Below are the different lines for correlation. Clearly, we are looking for a growth line similar to the one in the circle below.
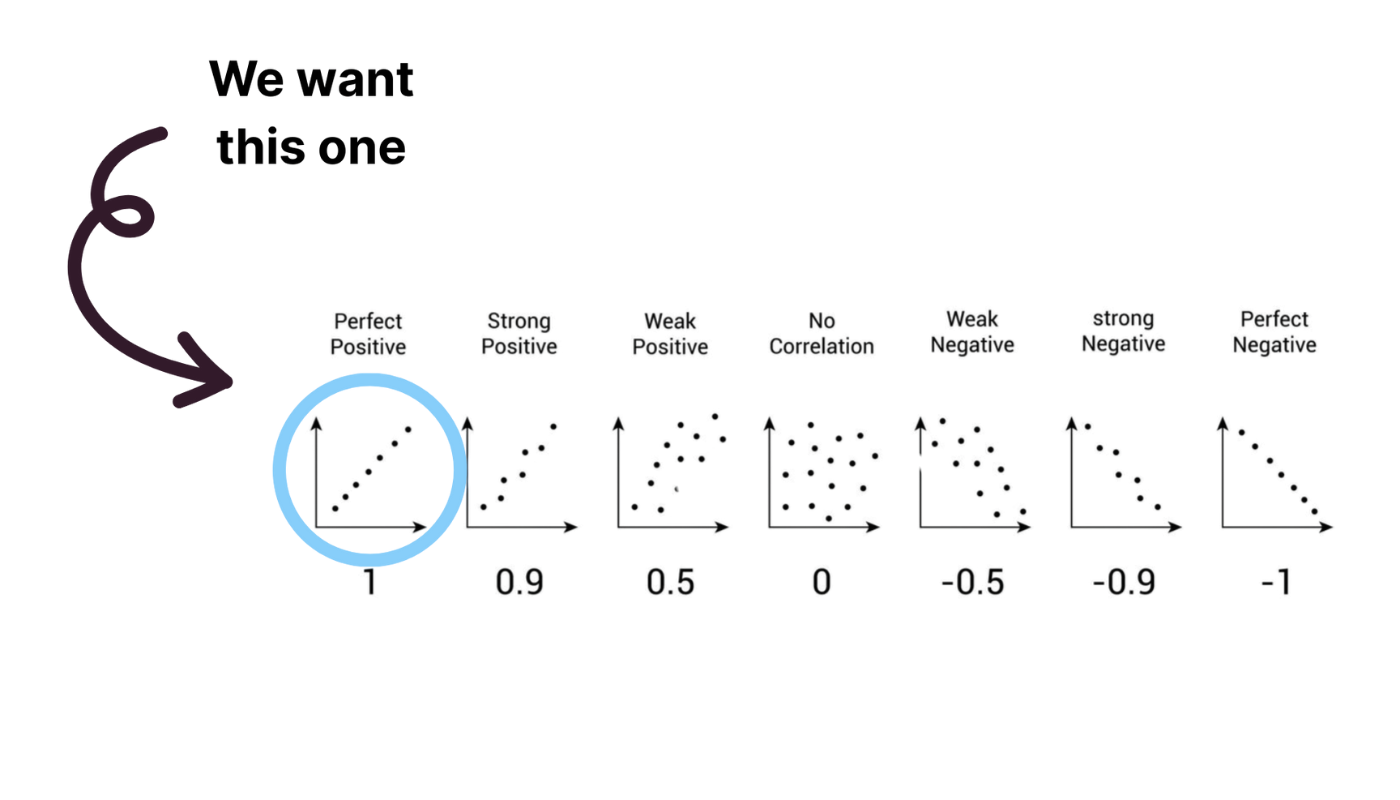
So if we have the formula for correlation, we can rank all companies based on that and then the ones that have the highest correlation (a correlation of 1), then we find the 'best' ones! Let's look at the formula for correlation.
Now this is gonna look scary, but stay with me here.
The formula for correlation is:
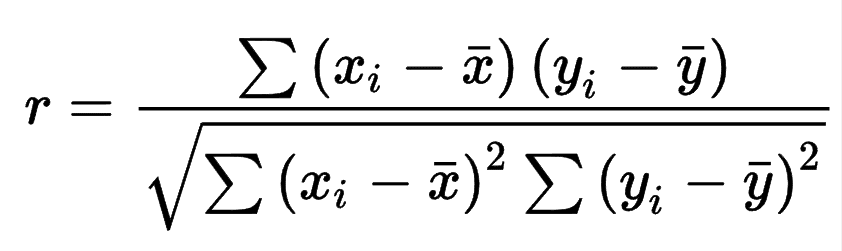

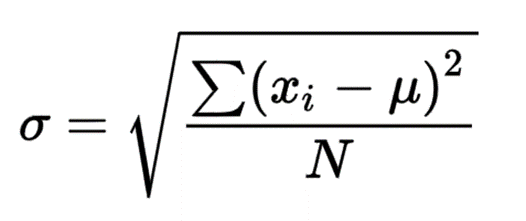
This formula can be simplified if you take into account that the denominator is very similar to the formula for standard deviation (below).
In Portfolio123 we can come up with a formula as described here.
But we can extend what is described there as follows...